Executive Overview tab
This tab displays high-level productivity data for upper management. The information is organized into the following subtabs:
-
Summary (default view)
-
Detail
Open the Executive Overview tab based on your user permissions.
Admin
User role requirement:
-
Productivity Admin
-
Go to Admin > Admin Task Panes > Productivity Admin > Bi-Weekly Productivity Reports > Department Management Productivity Dashboard
-
Select the refresh variables in the Filters panel.
TIP: Update the data any time by changing the refresh variables.
Non-admin
User role requirement:
-
Productivity User
-
Report Subsystem Permissions
-
Go to Main > Open App Menus > Productivity Management > Bi-Weekly Productivity Reports > Department Management Productivity Dashboard
-
Select the refresh variables in the Filters panel.
TIP: Update the data any time by changing the refresh variables.
Summary tab
View summarized metrics for the selected department.
NOTE: To switch views between Worked/Paid and Matrix/Graphs, click the toggles in the right corner. The default view is Worked/Matrix.
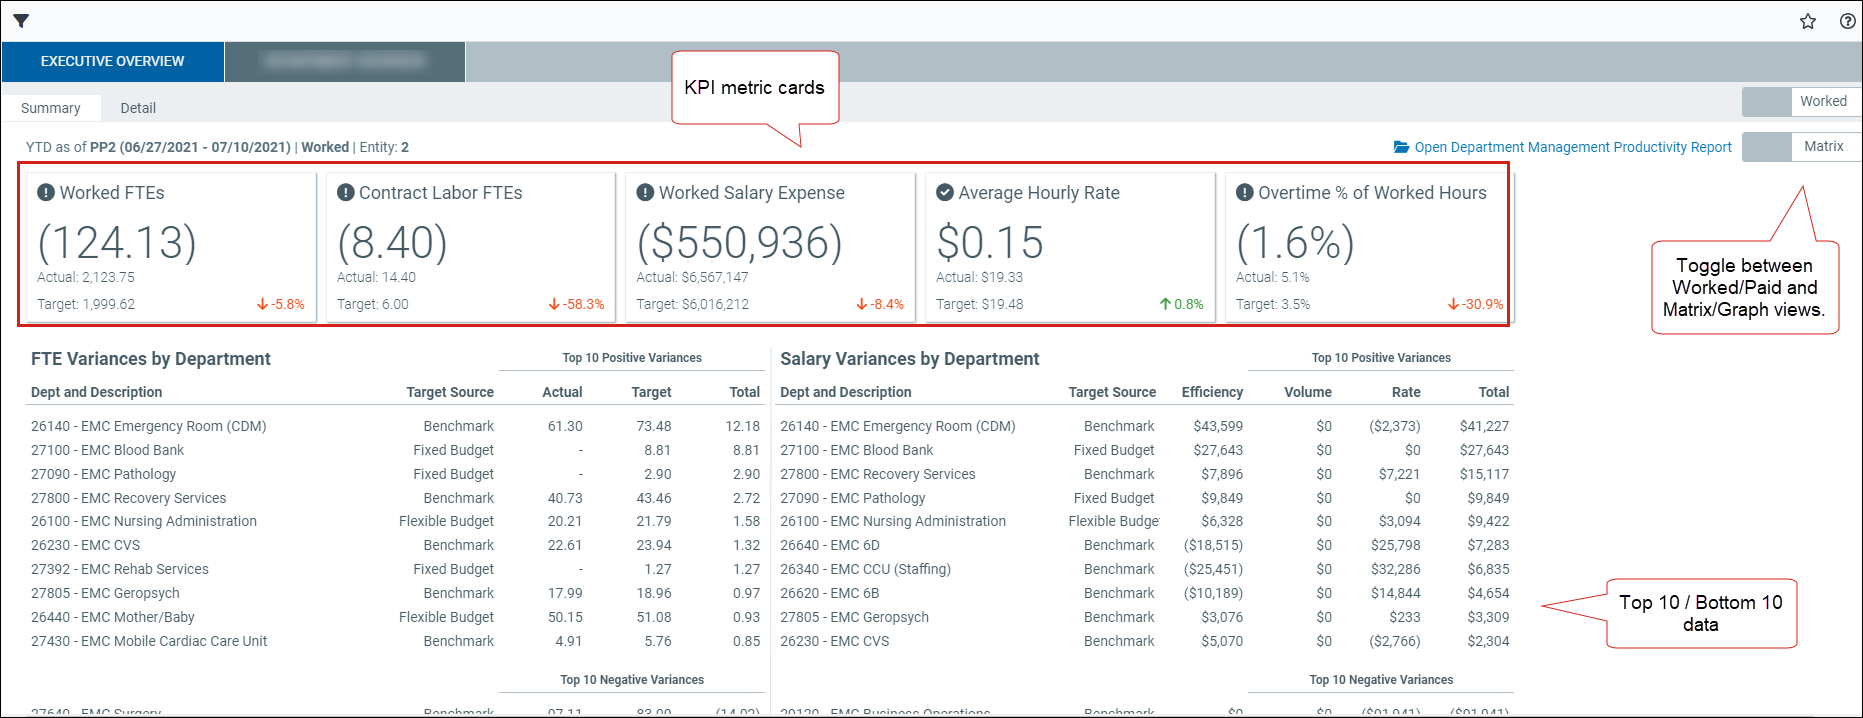
Matrix view
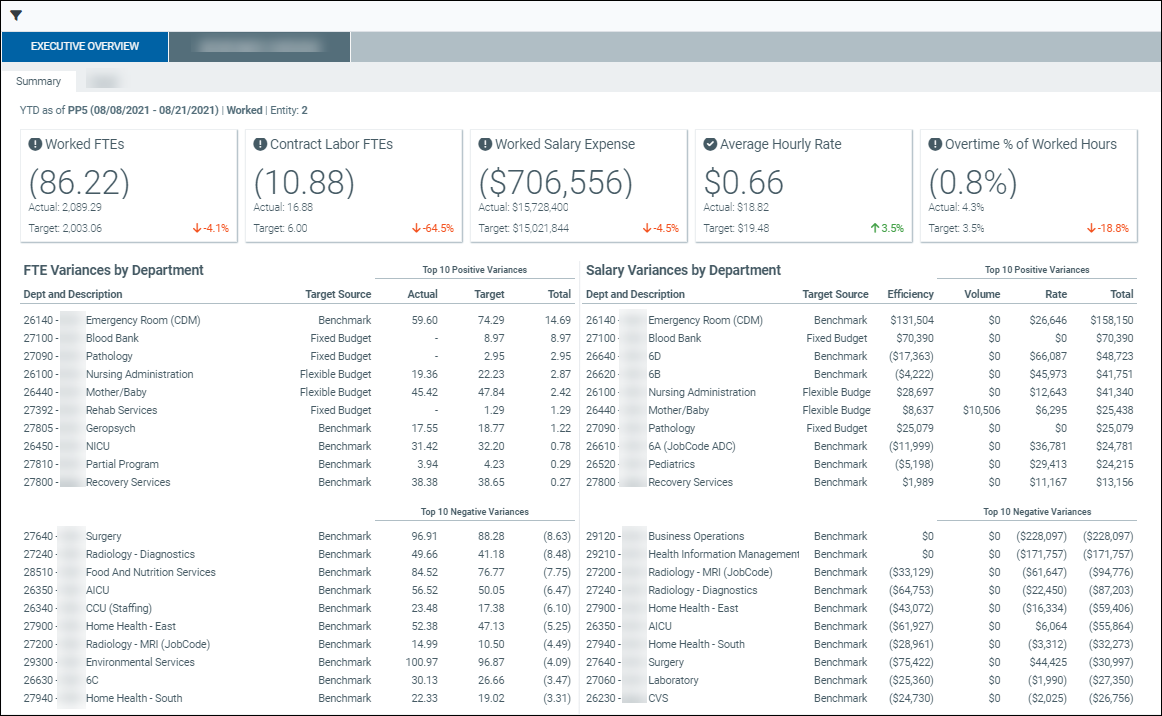
This table describes the matrix view for worked and paid items.
| Metric | Description |
|---|---|
| KPI metric cards |
Productivity information and comparisons of Actual to Target for the following:
|
| Top 10 Positive Variances | The top 10 favorable FTE and salary variances by department. |
| Top 10 Negative Variances | The bottom 10 unfavorable FTE and salary variances by department. |
Graph view
View interactive graphs for worked or paid items.
-
Hover over any bar in a graph to view respective information.
-
Click any term in the bottom legend to remove (or display) the data and view specific metrics.
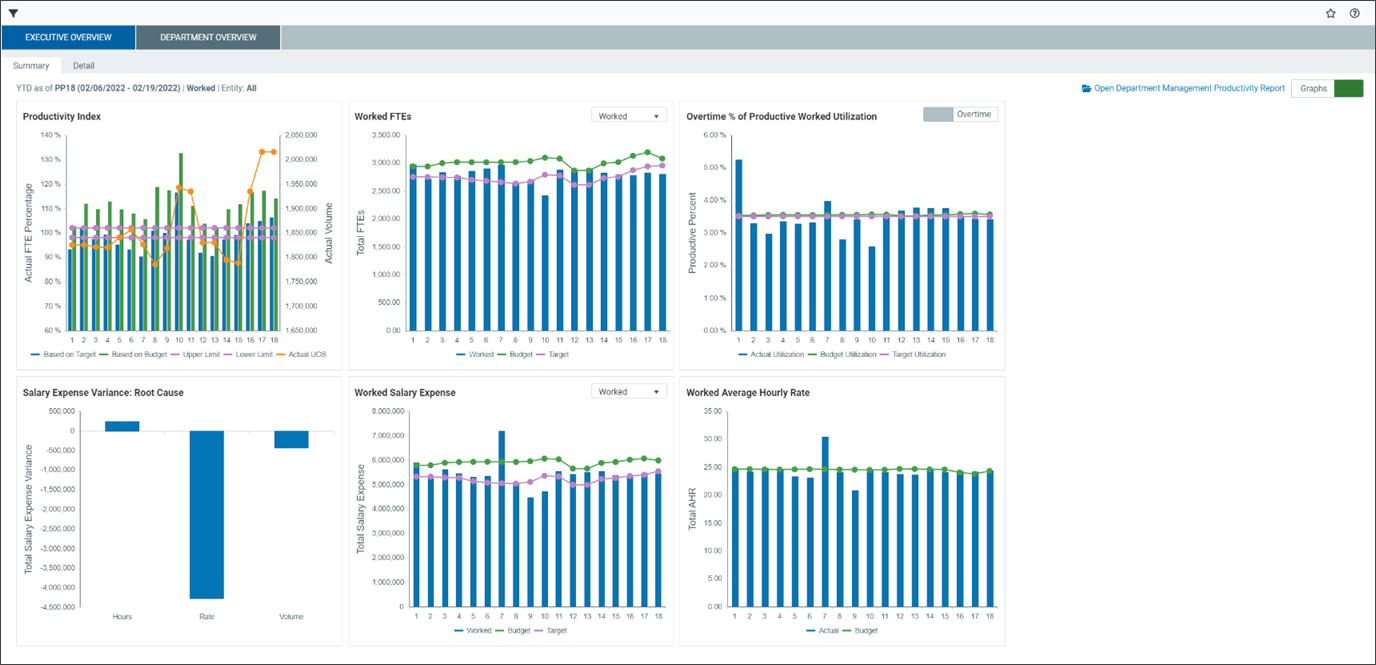
This table describes the graphs in the Summary tab.
| Graph | Description |
|---|---|
| Productivity Index |
A common productivity metric: target FTEs / actual FTEs. |
| Worked or Paid FTEs | Click the dropdown to select different classifications of FTEs in the graph. |
| Overtime or Premium % of Productive Worked Utilization |
Click the toggle to view Premium or Overtime metrics. Overtime %: overtime hours / productive worked hours. Premium %: premium dollars / productive worked dollars. |
| Salary Expense Variance: Root Cause | Shows what percentage the salary expense variance is attributed to the difference in hours, rates, or volume. |
| Worked or Paid Salary Expense |
Click the dropdown to select different pay type classifications in this graph. |
| Worked or Paid Average Hourly Rate |
Comparison of actual to budget average hourly rates. |
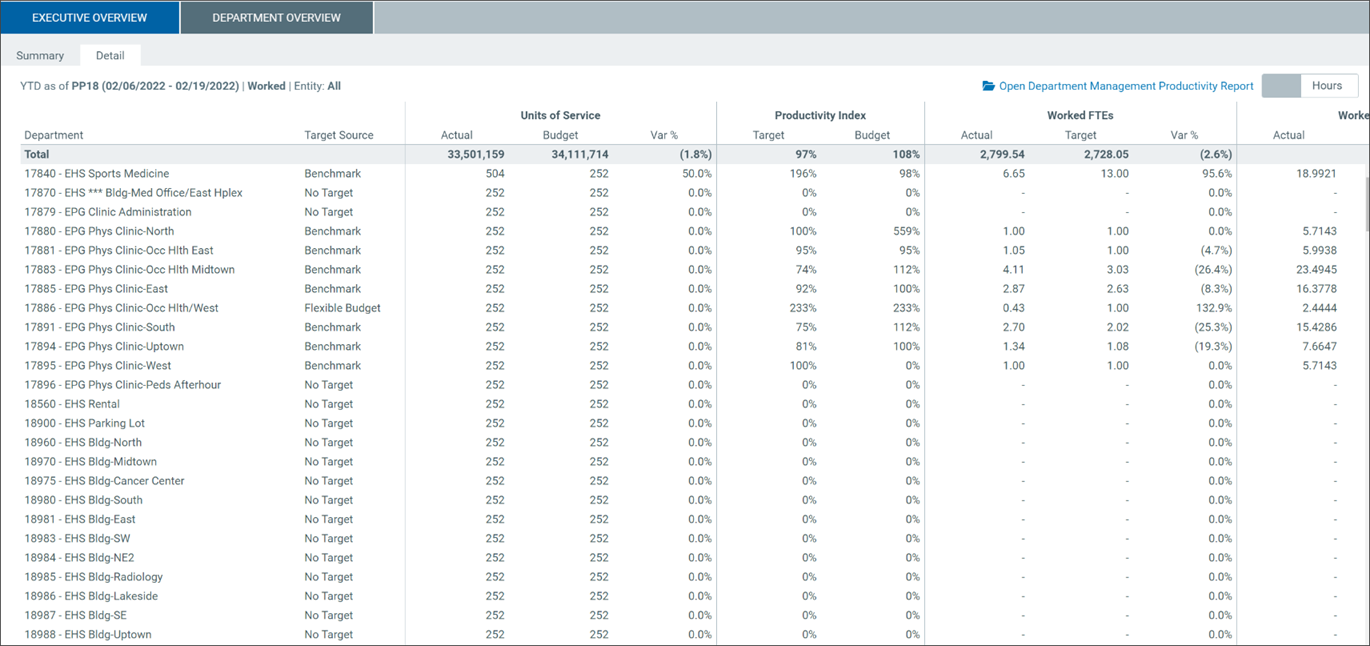
Detail tab
View details for the selected department.
NOTE: Click the toggles in the right corner to switch views between Worked/Paid and Hours/Dollars. The default view is Worked/Hours.